Adding Trace, Event, Counter and Error Logging to the OakLeaf Systems Azure Table Services Sample Project
• Updated 8/27/2010 with an explanation for long execution times with cloud execution or data storage.
I described my first tests with LoadStorm’s Web application load-testing tools with the OakLeaf Systems Azure Table Services Sample Project in a Load-Testing the OakLeaf Systems Azure Table Services Sample Project with up to 25 LoadStorm Users post of 11/18/2010. These tests were sufficiently promising to warrant instrumenting the project with Windows Azure Diagnostics.
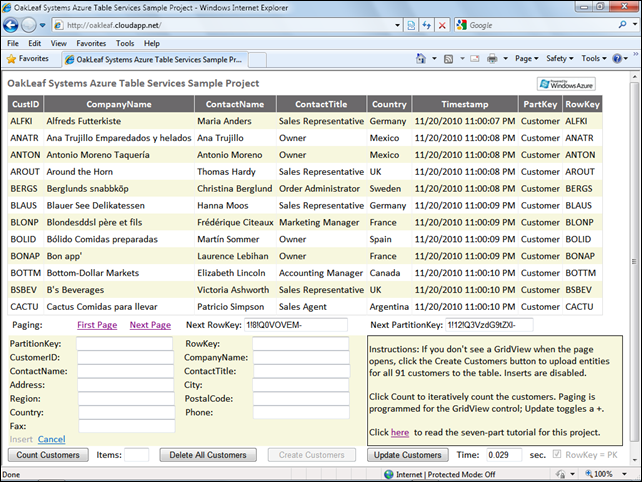
Users usually follow this pattern when opening the project for the first time (see above):
- Click the Next Page link a few times to verify that GridView paging works as expected.
- Click the Count Customers button to iteratively count the Customer table’s 91 records.
- Click the Delete All Customers button to remove the 91 rows from the Customers table.
- Click the Create Customers button to regenerate the 91 table rows from a Customer collection.
- Click the Update Customers button to add a + suffix to the Company name field.
- Click Update Customers again to remove the + suffix.
Only programmers and software testers would find the preceding process of interest; few would find it entertaining.
Setting Up and Running Load Tests
Before you can run a load test, you must add a LoadStorm.html page to your site root folder or a <!-- LoadStorm ##### --> (where ##### is a number assigned by LoadStorm) HTML comment in the site’s default page.
LoadStorm lets you emulate user actions by executing links with HTTP GET operations (clicking Next Page, then First Page) and clicking the Count Customers, Delete All Customers and Create Customers buttons in sequence with HTTP POST operations.
Step 6 is required to set the form up for the Create Customer step. Here’s the Load Test setup starting with 5 users and increasing to 25 users over 10 minutes:
Following are the results of the preceding load test:
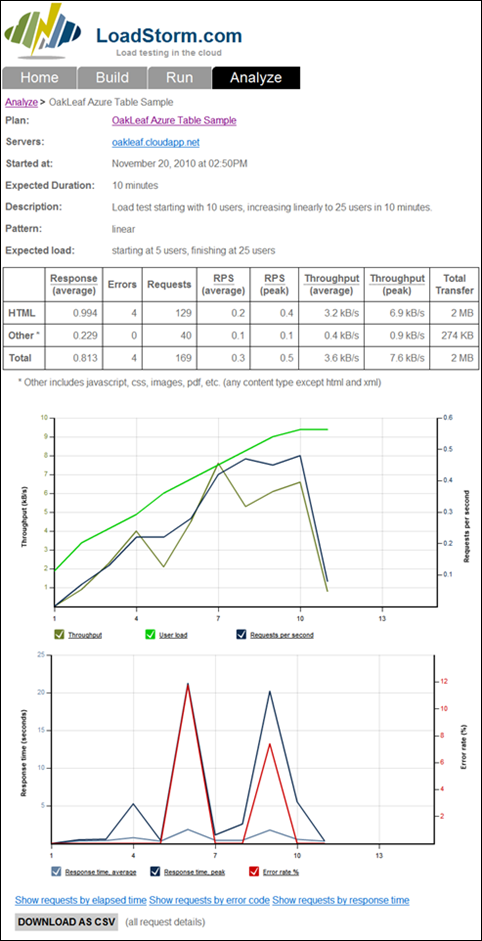
Finally, here’s the analysis of the preceding test run:
The analysis showed four errors occurred at about 6 and 9 minutes. The errors probably are the result of failure to complete the preceding task before invoking a successive GET or POST method.
Execution Time Summary
The following table shows the execution times in seconds for the individual operations with three operational configurations:
| Fabric/ Storage | Display Default | Count Customers | Delete All Customers | Create Customers | Update Customers 1 | Update Customers 2 |
| Dev/Dev | 0.237 | 0.051 | 2.154 | 2.107 | 2.517 | 1.985 |
| Dev/Prod | 1.291 | 0.188 | 14.281 | 30.146 | 31.219 | 33.909 |
| Prod/Prod | 0.045 | 0.270 | 3.987 | 19.477 | 21.325 | 20.191 |
The relatively long times for the project running in the Azure production fabric to perform iterative CRUD operations on tables in Azure production storage, compared with the same project running in the Azure development fabric with Azure production storage, is surprising. The production affinity group for compute and storage is USA South Central. I plan to use the load tests and a diagnostic files analyzer to see if I can determine the source of the problem.
• Update 8/27/2011: The long execution times for CRUD operations with cloud execution or cloud storage were subsequently greatly reduced by changing
serviceContext.SaveChanges();
statements to
serviceContext.SaveChanges(SaveChangesOptions.Batch);
This change executes CRUD operations in a single batch. The current UI includes a Batch Updates check box to enable comparisons.
LoadStorm’s CSV Test Reports
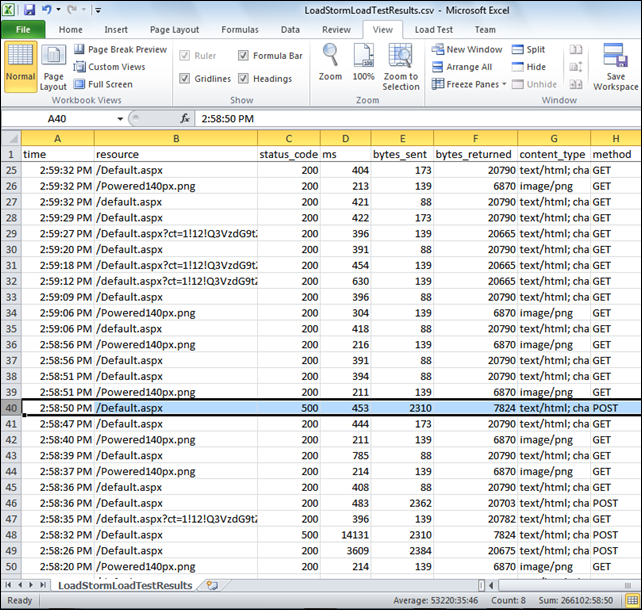
Following is a screen capture of Excel 2010 displaying the CSV file exported by clicking the preceding load test page’s Download As CSV button:
All errors were HTTP 500 (Internal Server) Errors, which Windows Azure Diagnostics should report.
Setting up Windows Azure Diagnostics
Following is the code added to the SampleWebCloudService.sln project to establish Windows Azure Diagnostics (WAD) in accordance with the Microsoft Systems Center team’s Monitoring and Diagnostic Guidance for Windows Azure–hosted Applications white paper of 6/21/1020 by Brian Copps:
public class WebRole : RoleEntryPoint { public override bool OnStart() { // Restart the role upon all configuration changes RoleEnvironment.Changing += RoleEnvironmentChanging; // All Windows Azure diagnostic code added 11/20/2010 DiagnosticMonitorConfiguration dmc = DiagnosticMonitor.GetDefaultInitialConfiguration(); // Windows Performance Counters List<string> counters = new List<string>(); counters.Add(@"\Processor(_Total)\% Processor Time"); counters.Add(@"\Memory\Available Mbytes"); counters.Add(@"\TCPv4\Connections Established"); counters.Add(@"\ASP.NET Applications(__Total__)\Requests/Sec"); counters.Add(@"\Network Interface(*)\Bytes Received/sec"); counters.Add(@"\Network Interface(*)\Bytes Sent/sec"); foreach (string counter in counters) { PerformanceCounterConfiguration counterConfig = new PerformanceCounterConfiguration(); counterConfig.CounterSpecifier = counter; counterConfig.SampleRate = TimeSpan.FromSeconds(5); dmc.PerformanceCounters.DataSources.Add(counterConfig); } dmc.PerformanceCounters.ScheduledTransferPeriod = TimeSpan.FromMinutes(1); // Windows Event Logs dmc.WindowsEventLog.DataSources.Add("System!*"); dmc.WindowsEventLog.DataSources.Add("Application!*"); dmc.WindowsEventLog.ScheduledTransferPeriod = TimeSpan.FromMinutes(1); dmc.WindowsEventLog.ScheduledTransferLogLevelFilter = LogLevel.Warning; // Azure Trace Logs dmc.Logs.ScheduledTransferPeriod = TimeSpan.FromMinutes(1); dmc.Logs.ScheduledTransferLogLevelFilter = LogLevel.Warning; // Crash Dumps CrashDumps.EnableCollection(true);//IIS Logs dmc.Directories.ScheduledTransferPeriod = TimeSpan.FromMinutes(1);DiagnosticMonitor.AllowInsecureRemoteConnections = true; DiagnosticMonitor.Start("DiagnosticsConnectionString", dmc); Trace.WriteLine("WAD Monitor started", "Information"); // Update 11/14/2010 Microsoft.WindowsAzure.CloudStorageAccount.SetConfigurationSettingPublisher((configName, configSetter) => { configSetter(Microsoft.WindowsAzure.ServiceRuntime.RoleEnvironment.GetConfigurationSettingValue(configName)); }); Trace.WriteLine("ConfigurationSettingPublisher set", "Information"); return base.OnStart(); } private void RoleEnvironmentChanging(object sender, RoleEnvironmentChangingEventArgs e) { if (e.Changes.Any(change => change is RoleEnvironmentConfigurationSettingChange)) e.Cancel = true; } }
The Web.config file for the Web Role contains the following two added sections, which enable WAD and tracing failed IIS requests:
  <system.diagnostics>
    <trace>
      <listeners>
        <add type="Microsoft.WindowsAzure.Diagnostics.DiagnosticMonitorTraceListener,
             Microsoft.WindowsAzure.Diagnostics, Version=1.0.0.0, Culture=neutral,
             PublicKeyToken=31bf3856ad364e35" name="AzureDiagnostics">
          <filter type=""/>
        </add>
      </listeners>
    </trace>
  </system.diagnostics>
and Failed Request Tracking:
    <system.webServer>
      <tracing>
        <traceFailedRequests>
          <add path="Default.aspx">
            <traceAreas>
              <add provider="ASP" verbosity="Verbose" />
              <add provider="ASPNET" areas="Infrastructure,Module,Page,AppServices" verbosity="Verbose" />
              <add provider="ISAPI Extension" verbosity="Verbose" />
              <add provider="WWW Server" areas="Authentication,Security,Filter,StaticFile,CGI,Compression,Cache,RequestNotifications,Module" verbosity="Verbose" />
            </traceAreas>
            <failureDefinitions statusCodes="400-599" />
          </add>
        </traceFailedRequests>
      </tracing>
    </system.webServer>
Verifying WAD with Cerebrata’s Azure Diagnostics Manager
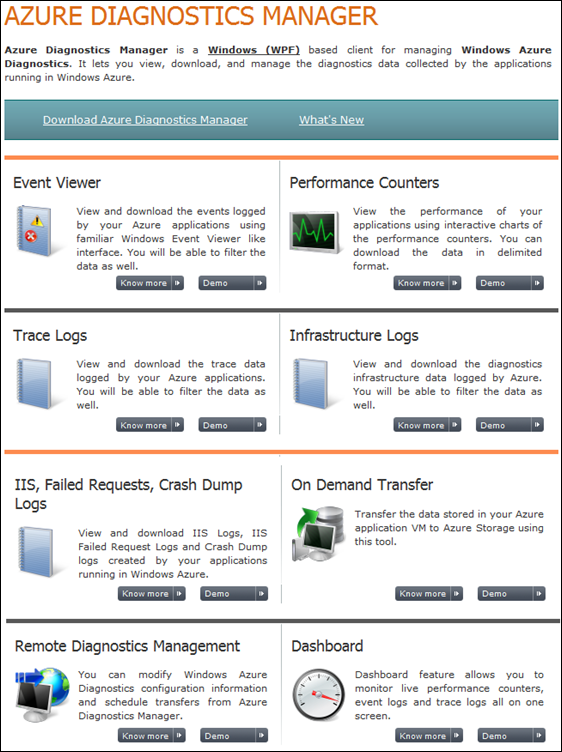
You need a log viewing application to verify that all WAD log files are being generated by the code you add, as well as your Web.config file modifications. Cerebrata Software Pvt. Ltd. introduced its Azure Diagnostics Manager (ADM) in September 2010 and offers a 30 day free trial. Cerebrata described ADM on 11/22/2010 as follows:
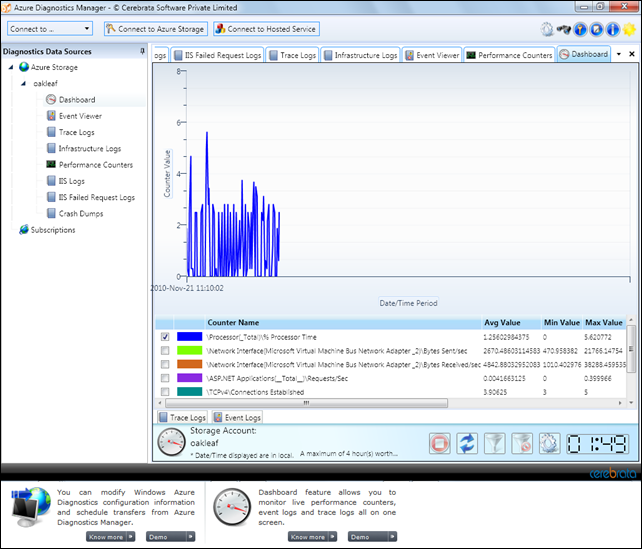
Following is a screen capture of the Cerebrata ADM Dashboard showing % Processor time for a repeat of the preceding test on 11/21/2010:
Here’s the list of 15 IIS Failed Request Logs of HTTP 500 errors:
And the Compact View of the the first IIS Failed Request Log, which tells you more than you’re likely to want to know about these failures:
The updated source code contains multiple trace log entry instructions, such as:
Trace.WriteLine("WAD Monitor started", "Information");
that generate Cerebrata Trace Log items:
Here’s Excel 2010 displaying the bottom of the CSV file exported by clicking the down-arrow at the bottom right of the preceding capture:
As time is available, I’ll report in future posts about troubleshooting with the aid of WAD what appear to be issues with the performance of the sample project when adding and updating customer records.




0 comments:
Post a Comment